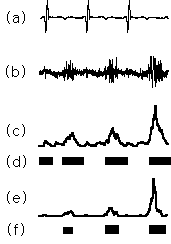
Fig. 1(b) shows an example of the SNA recorded from the cardiac nerve in anesthetized cats. The large amplitude signals reflect the synchronized SNA. On the other hand, the small amplitude signals in the neighborhood of the baseline are regarded as either small nonsynchronized neural discharges or noise. There is a statistical difference between the large and small amplitude signals. The synchronized SNA is detected by this difference, which is given from statistics obtained from the population variance of each signal. If the statistics has a significant difference by aƒÔ square test, then the large amplitude signal having large variance is identified as a synchronized SNA.

Fig. 2(d) and (f) show the synchronized SNA obtained by using analog techniques and the newly developed statistical method, respectively. The regions of synchronized SNA detected by the statistical method were significantly smaller than that by previous analog techniques and agree approximately with the regions of large amplitude of SNA.
(a) Electrocardiogram. (b) Original cardiac SNA. (c)Integrated SNA. (d) Detected synchronized SNA by analog techniques. (e) Statistic of the SNA. (f) Detected synchronized SNA by statistic method (significant level = 0.05).